CSC OCT Analyser
Central serous chorioretinopathy detection on OCT B-scans with five fused CNNs, selectable screening and balanced operating points, and referral of uncertain scans to a clinician. The study behind it also checks whether high scores come from the disease or from how the images were collected.
Sai Sathya Krishna A R, Karthik B, Adharsh Ramakrishnan, Dr. Swaminathan A · VIT Chennai
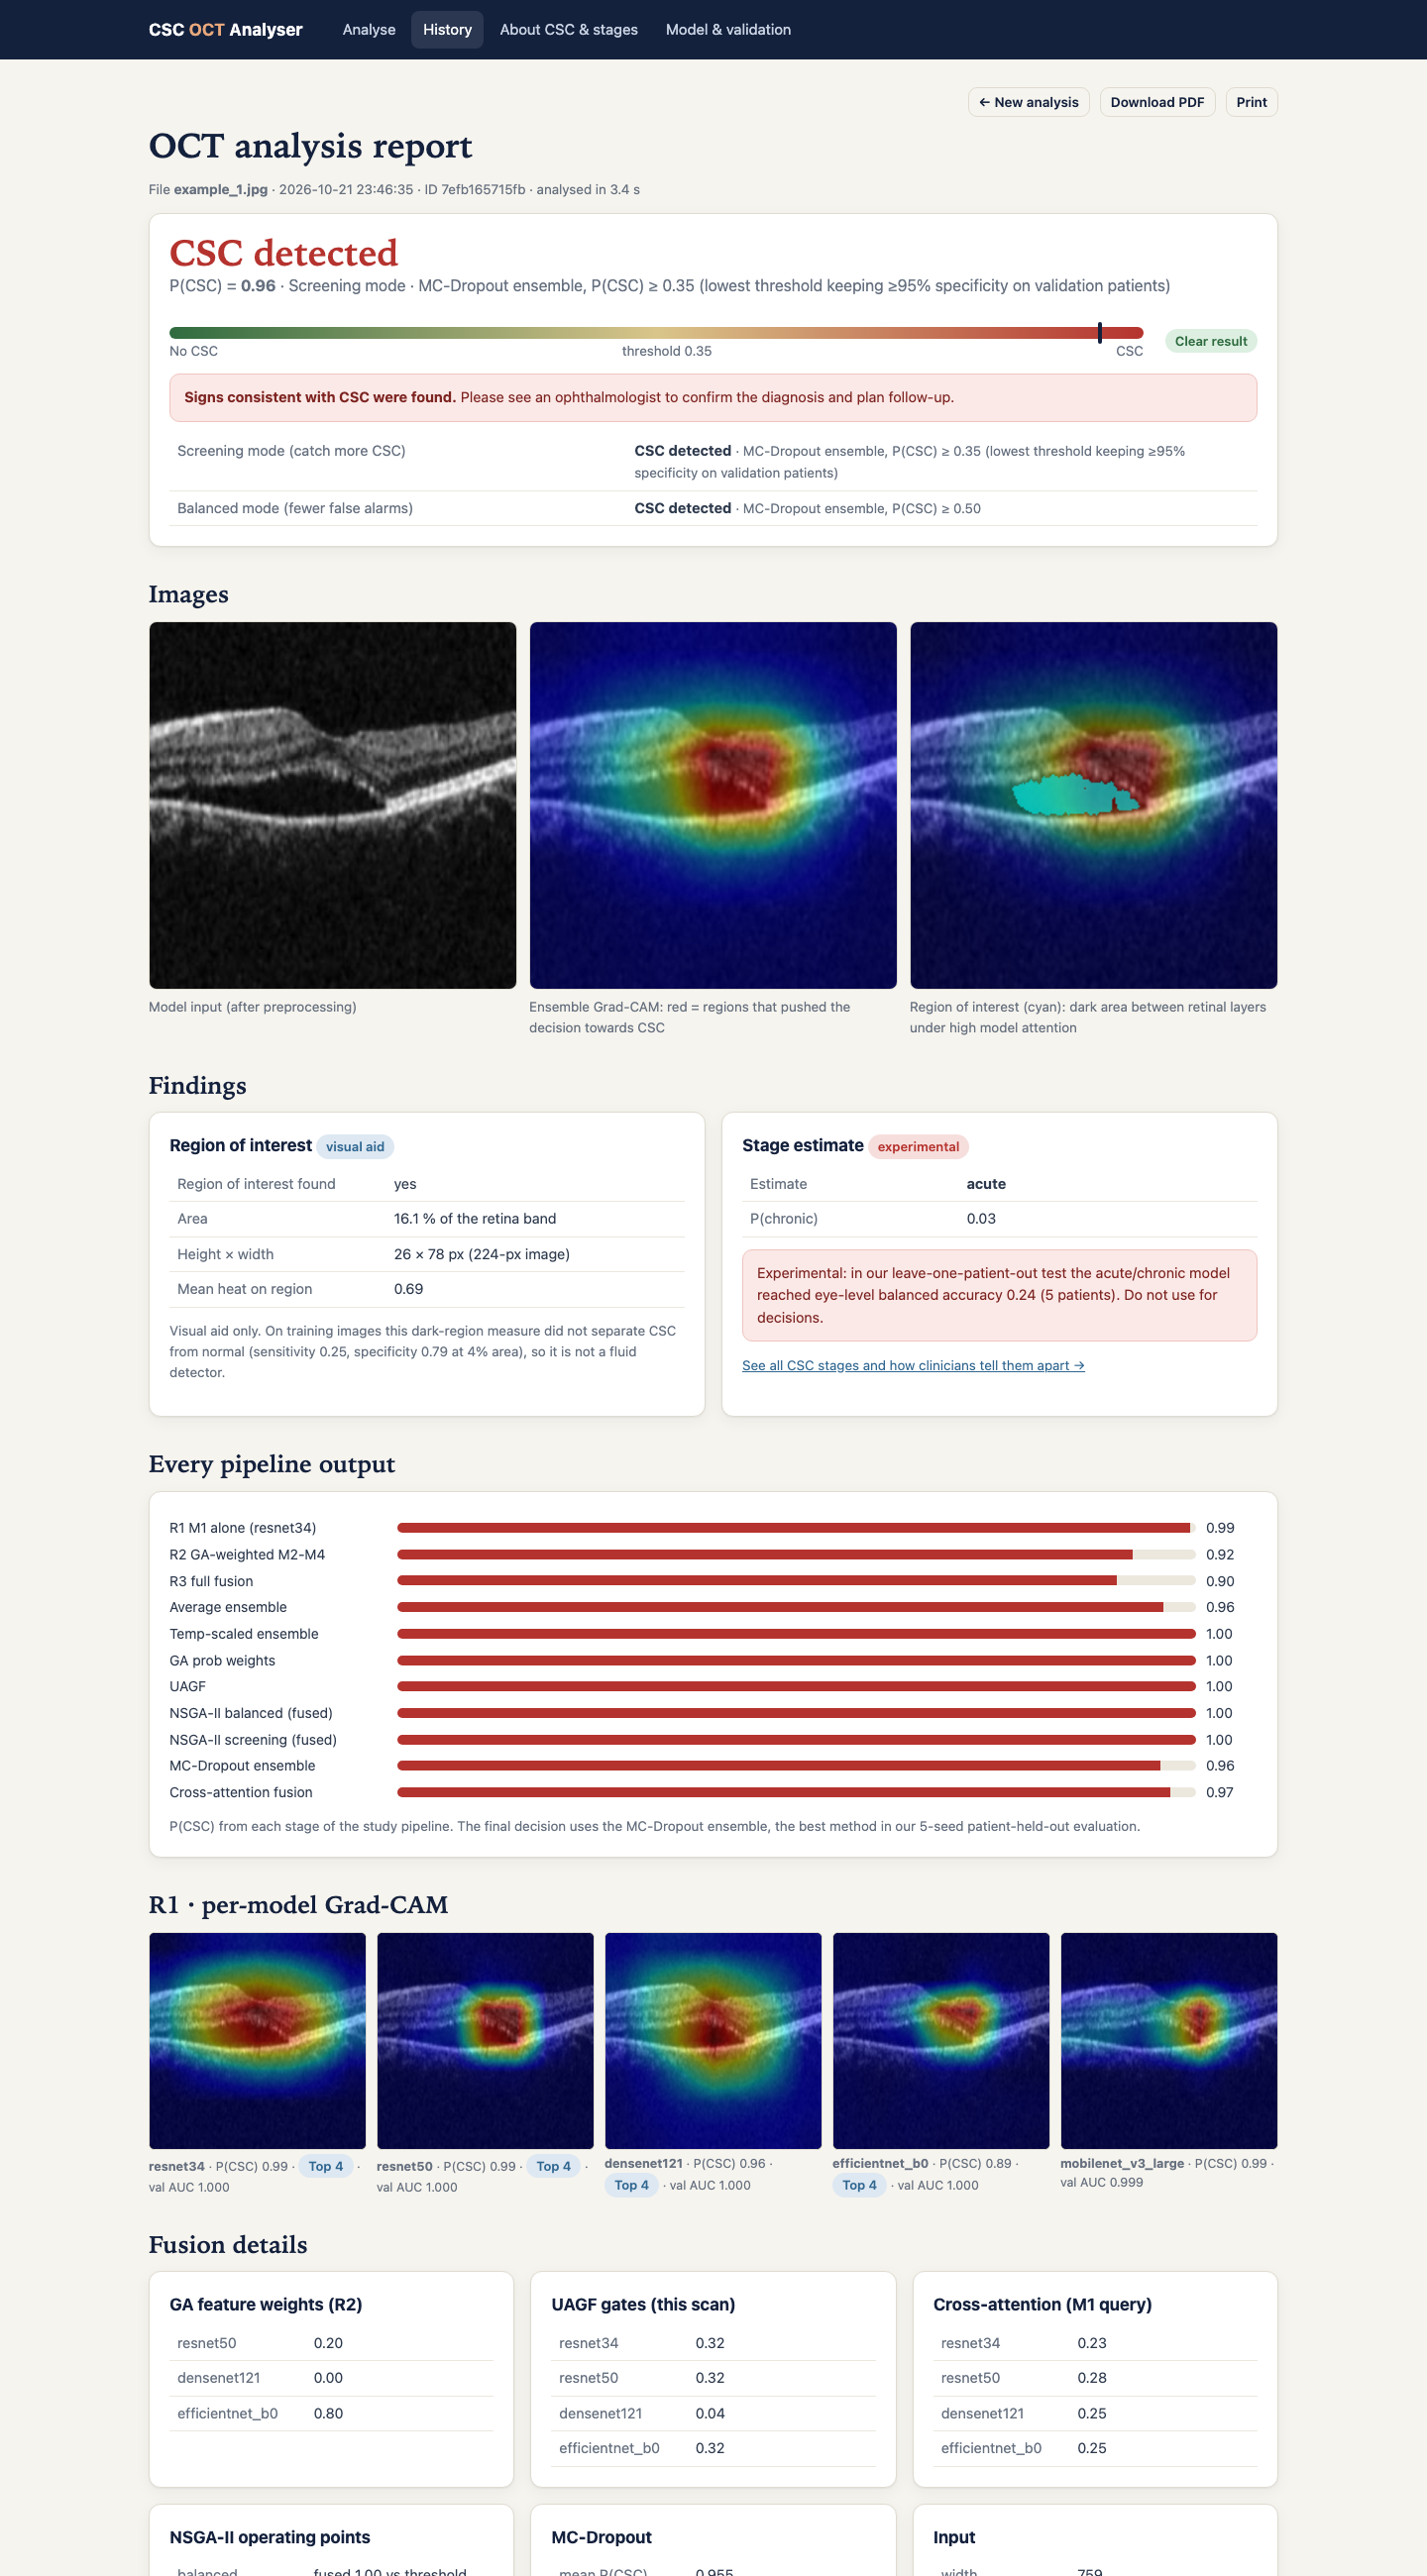
Key results
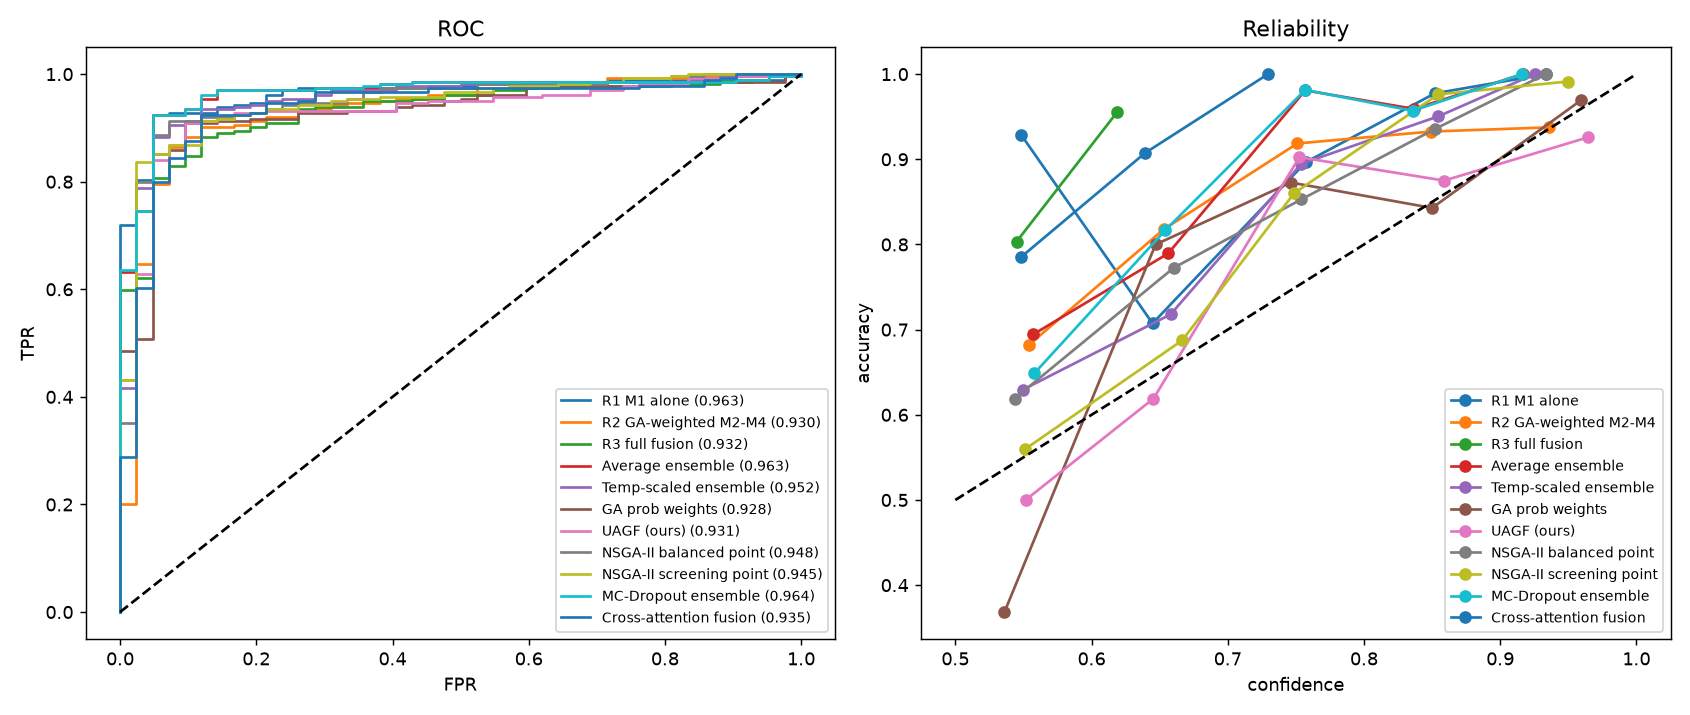
Best per-seed AUC (average and MC-dropout ensembles)0.954
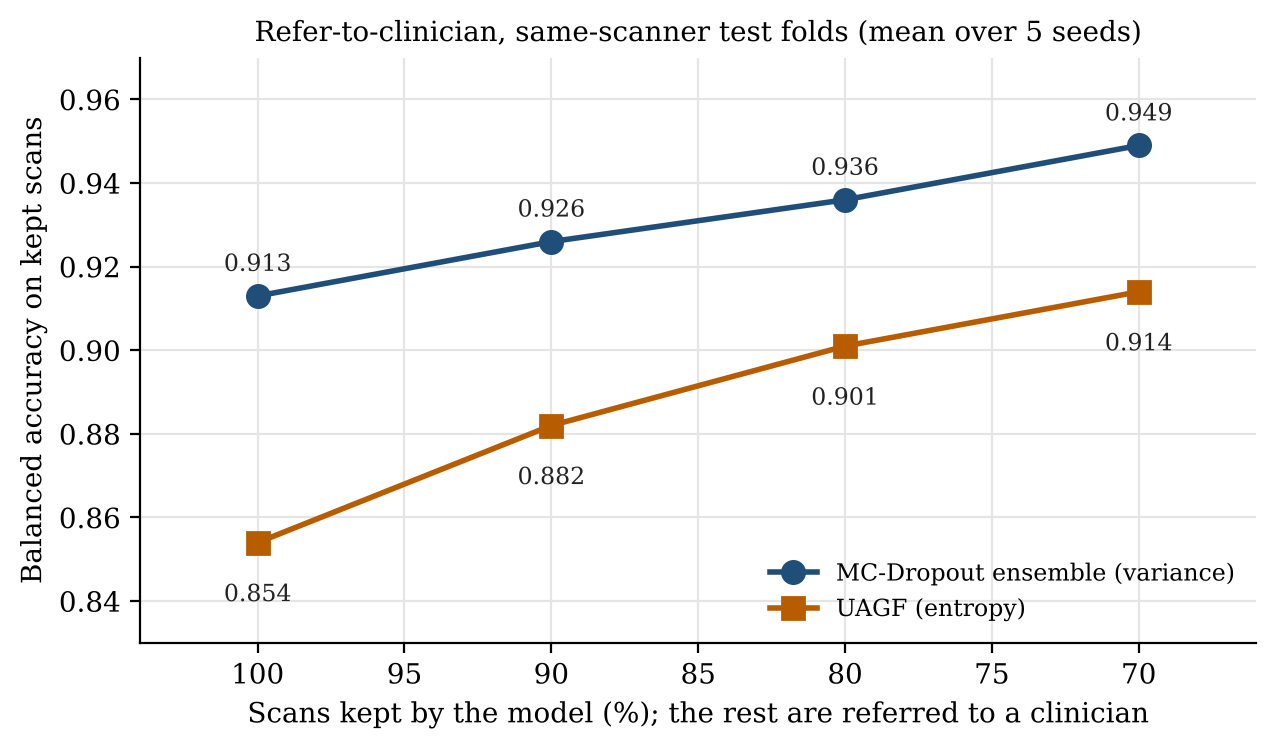
Balanced accuracy, all scans → 30% referred0.913 → 0.949
Matched-type AUC (same export type)≈ 0.78
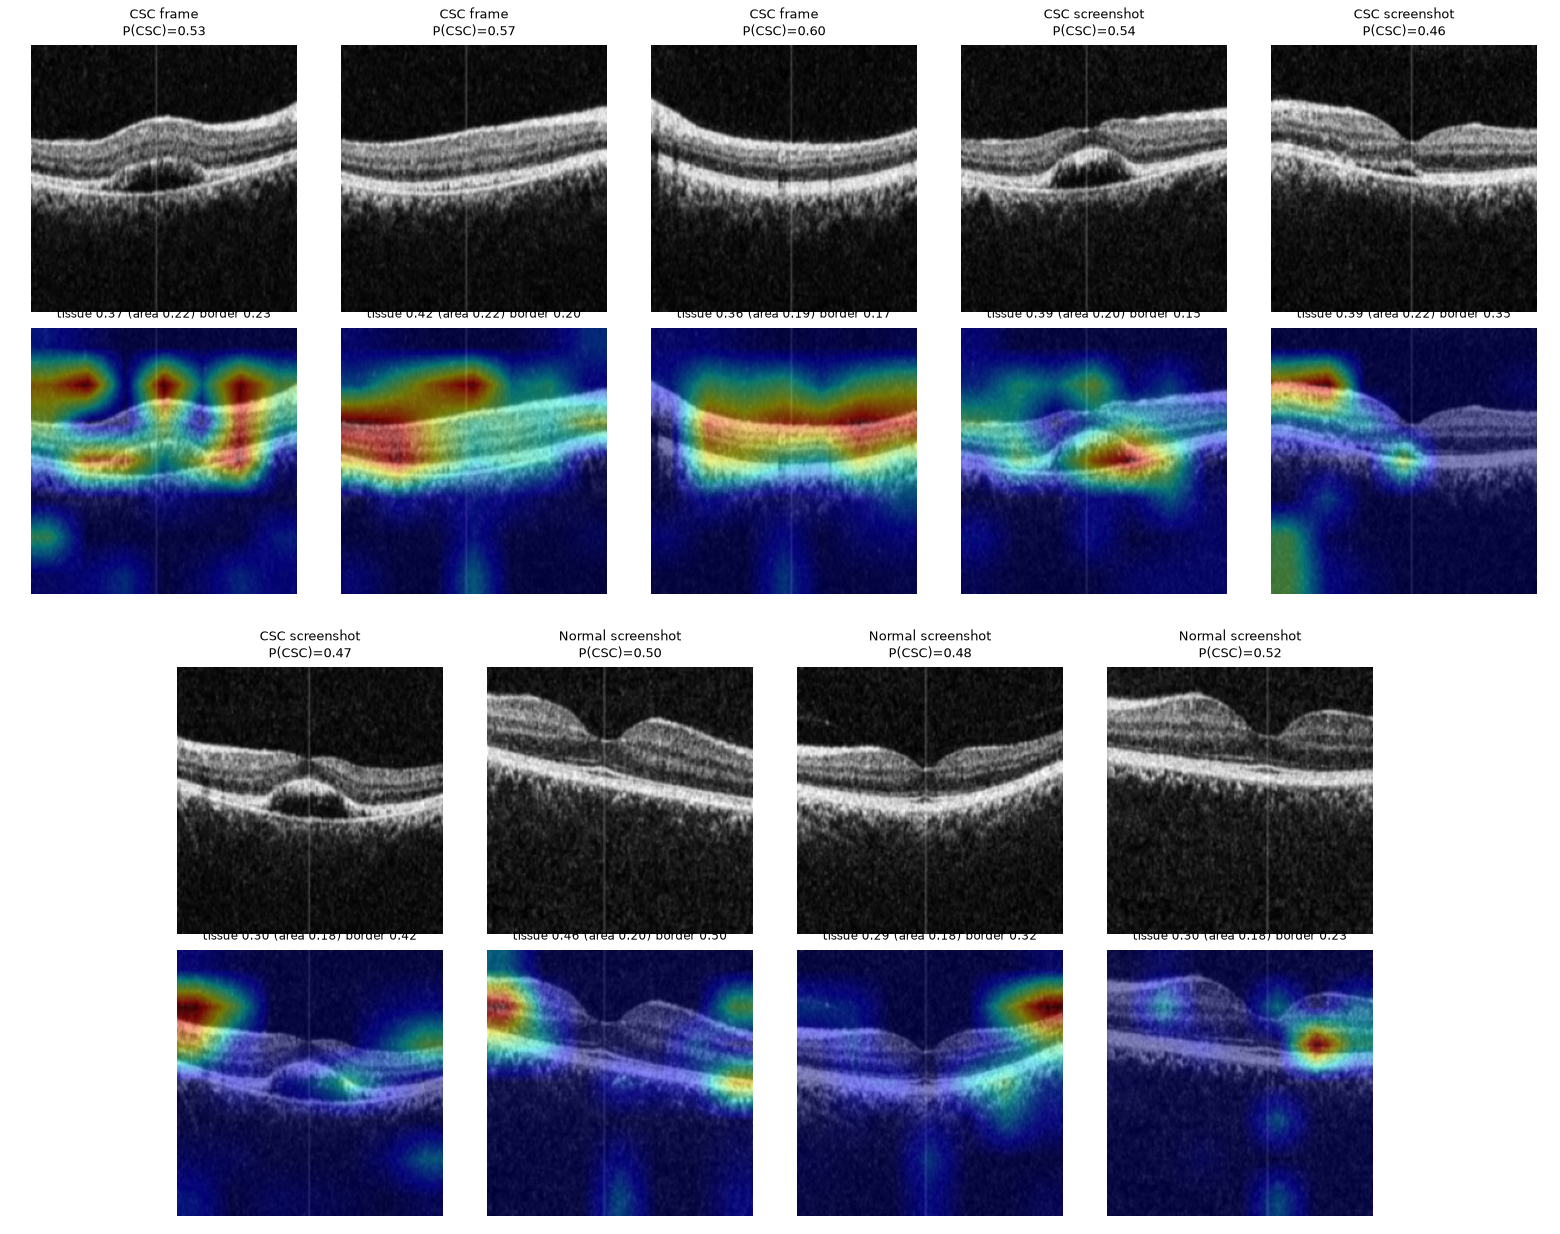
OCT-C8 from 16 × 16 thumbnailsAUC 1.000
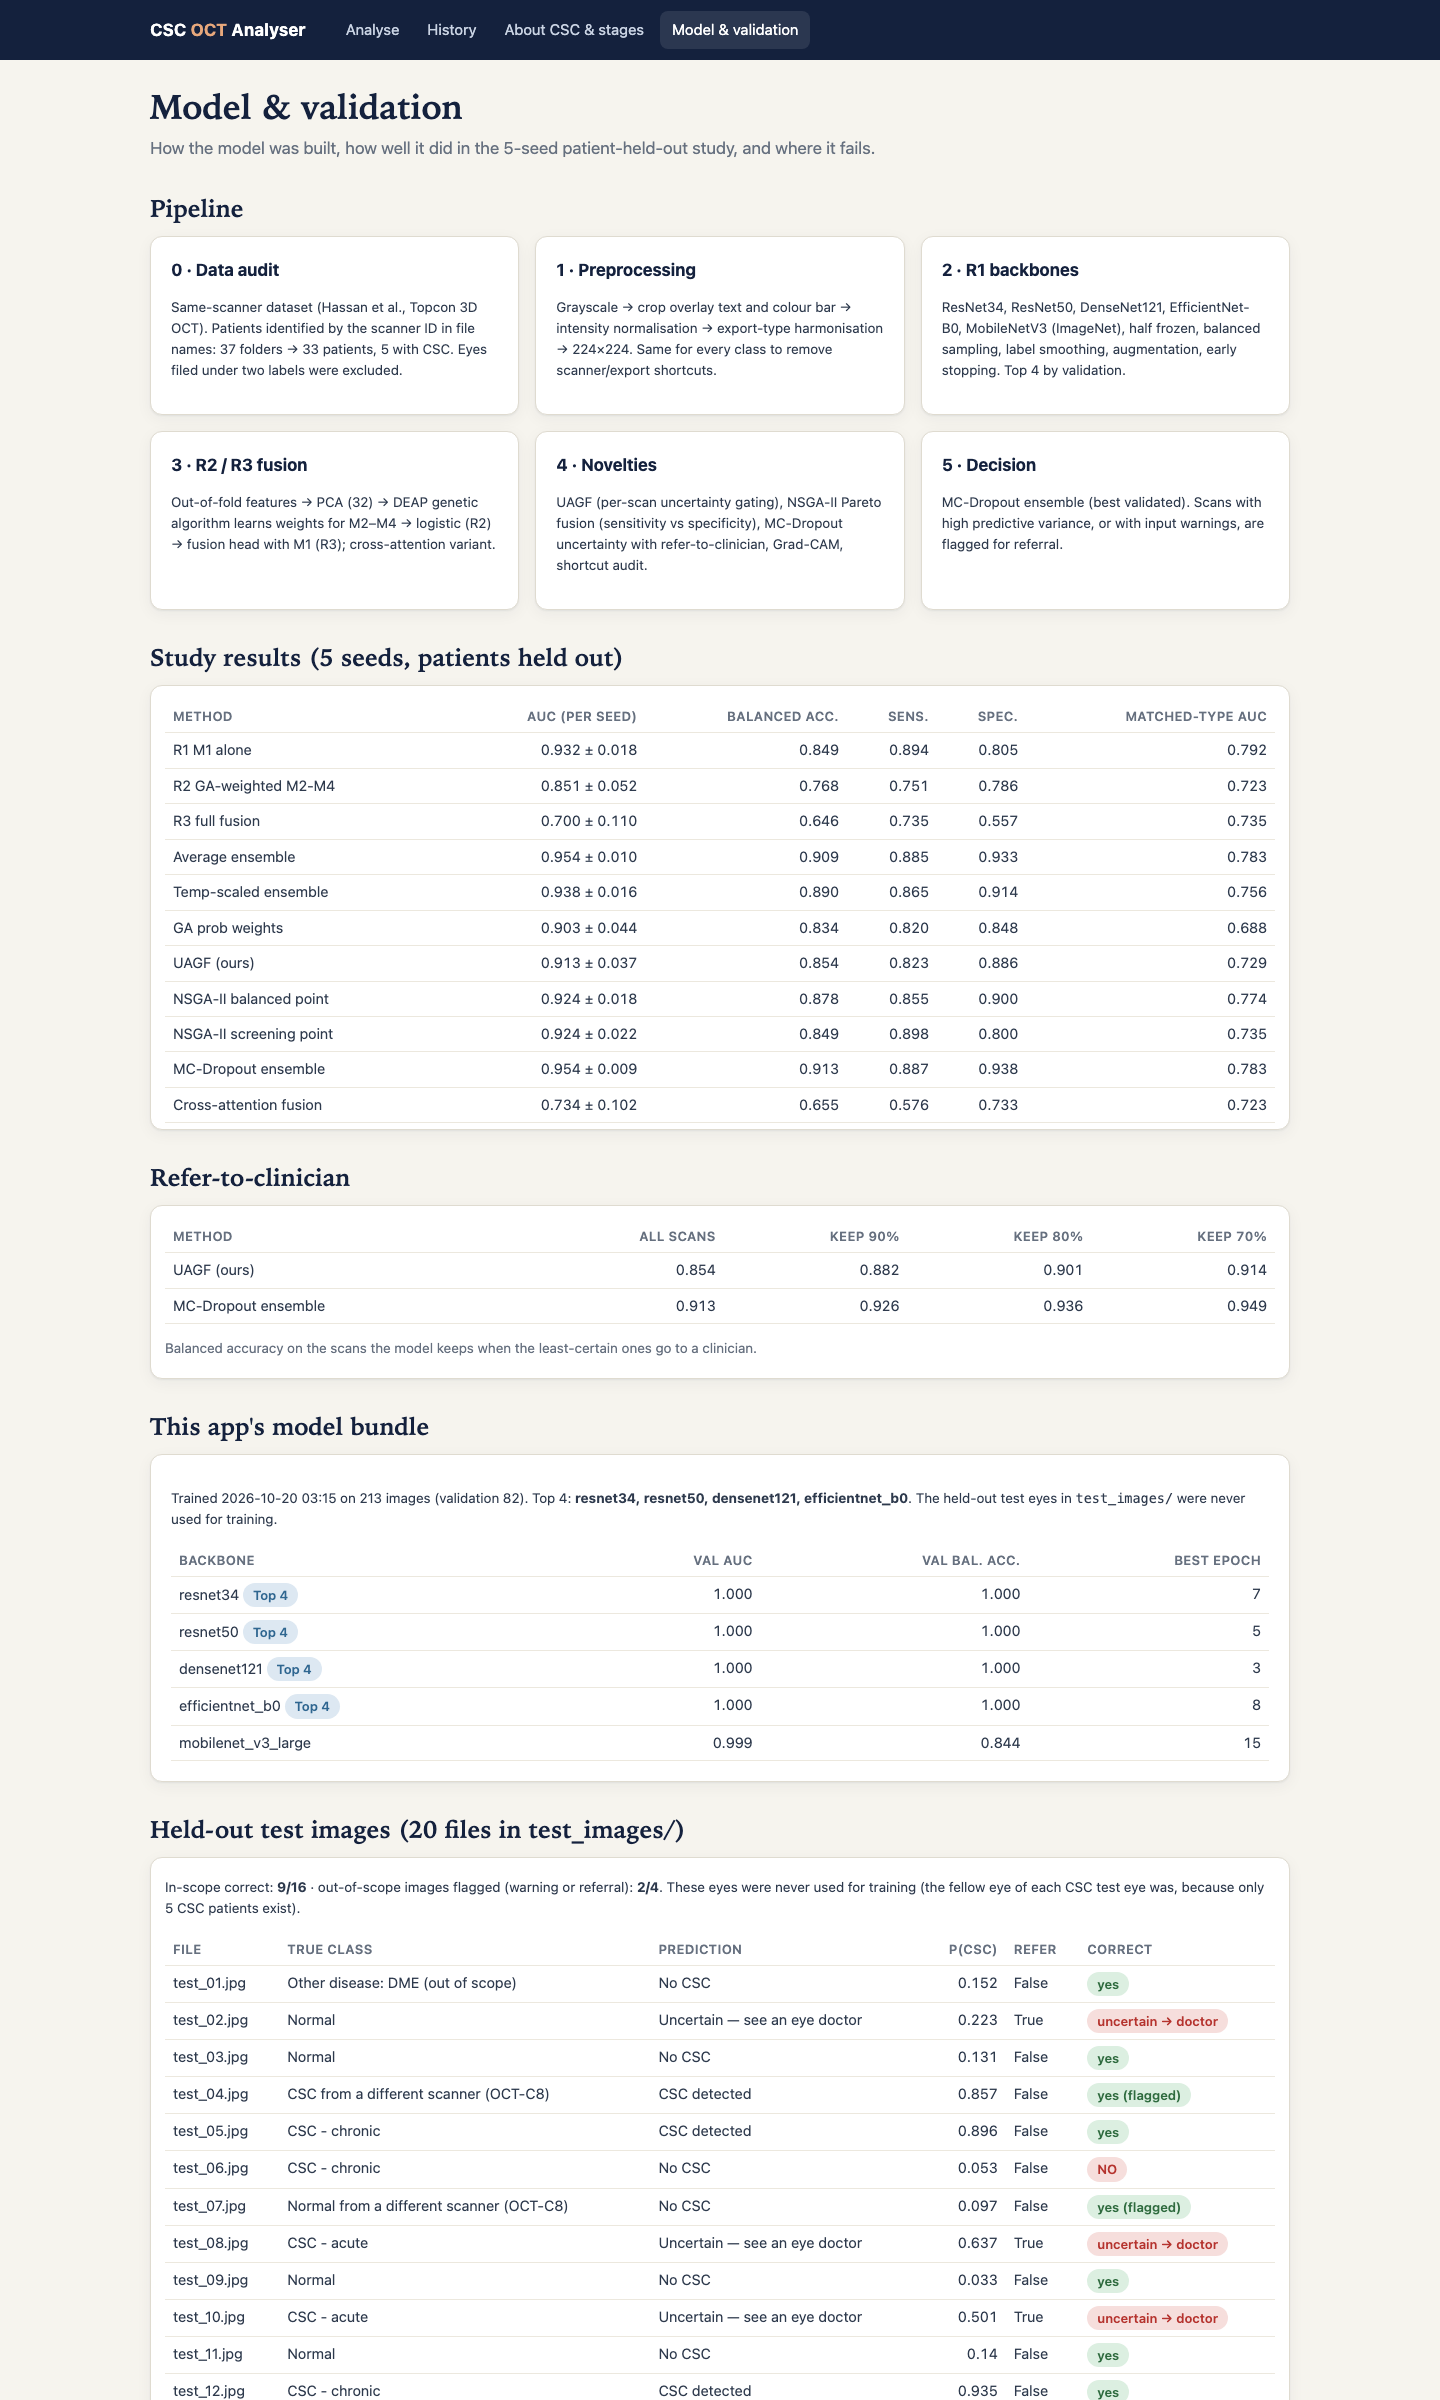
| Method | AUC per seed | Balanced acc. | Sens. | Spec. | Matched-type AUC |
|---|---|---|---|---|---|
| R1 M1 alone | 0.932 ± 0.018 | 0.849 ± 0.025 | 0.894 | 0.805 | 0.792 |
| R2 GA-weighted M2–M4 | 0.851 ± 0.052 | 0.768 ± 0.045 | 0.751 | 0.786 | 0.723 |
| R3 full fusion | 0.700 ± 0.110 | 0.646 ± 0.082 | 0.735 | 0.557 | 0.735 |
| Average ensemble | 0.954 ± 0.010 | 0.909 ± 0.016 | 0.885 | 0.933 | 0.783 |
| Temperature-scaled ensemble | 0.938 ± 0.016 | 0.890 ± 0.032 | 0.865 | 0.914 | 0.756 |
| GA probability weights | 0.903 ± 0.044 | 0.834 ± 0.068 | 0.820 | 0.848 | 0.688 |
| UAGF | 0.913 ± 0.037 | 0.854 ± 0.047 | 0.823 | 0.886 | 0.729 |
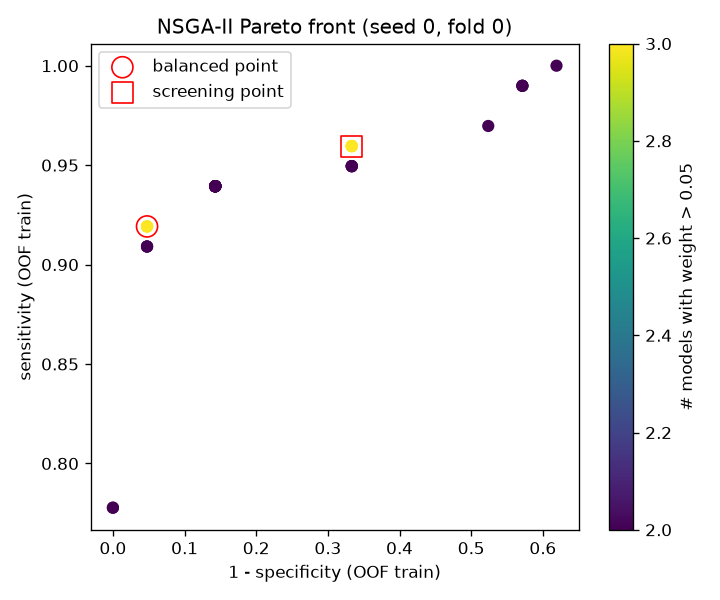
| NSGA-II balanced point | 0.924 ± 0.018 | 0.878 ± 0.027 | 0.855 | 0.900 | 0.774 |
| NSGA-II screening point | 0.924 ± 0.022 | 0.849 ± 0.021 | 0.898 | 0.800 | 0.735 |
| MC-dropout ensemble | 0.954 ± 0.009 | 0.913 ± 0.015 | 0.887 | 0.938 | 0.783 |
| Cross-attention fusion | 0.734 ± 0.102 | 0.655 ± 0.084 | 0.576 | 0.733 | 0.723 |
Same-scanner dataset, 5 seeds × 4 patient-grouped folds. Simple probability ensembles beat GA-weighted feature fusion here, because each training fold held only two CSC patient groups.
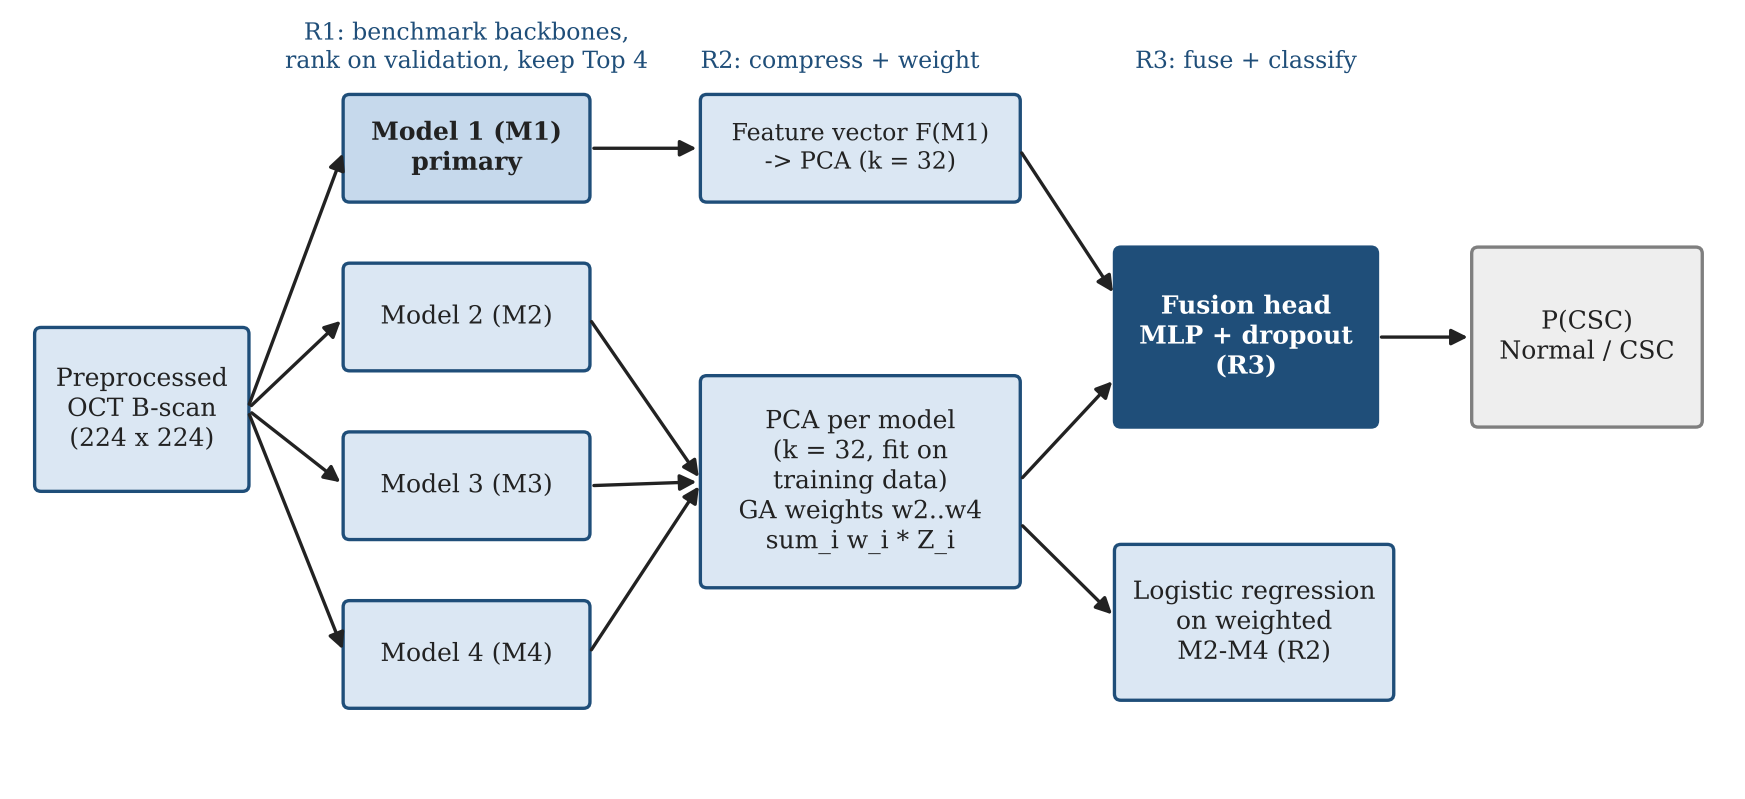
How it works
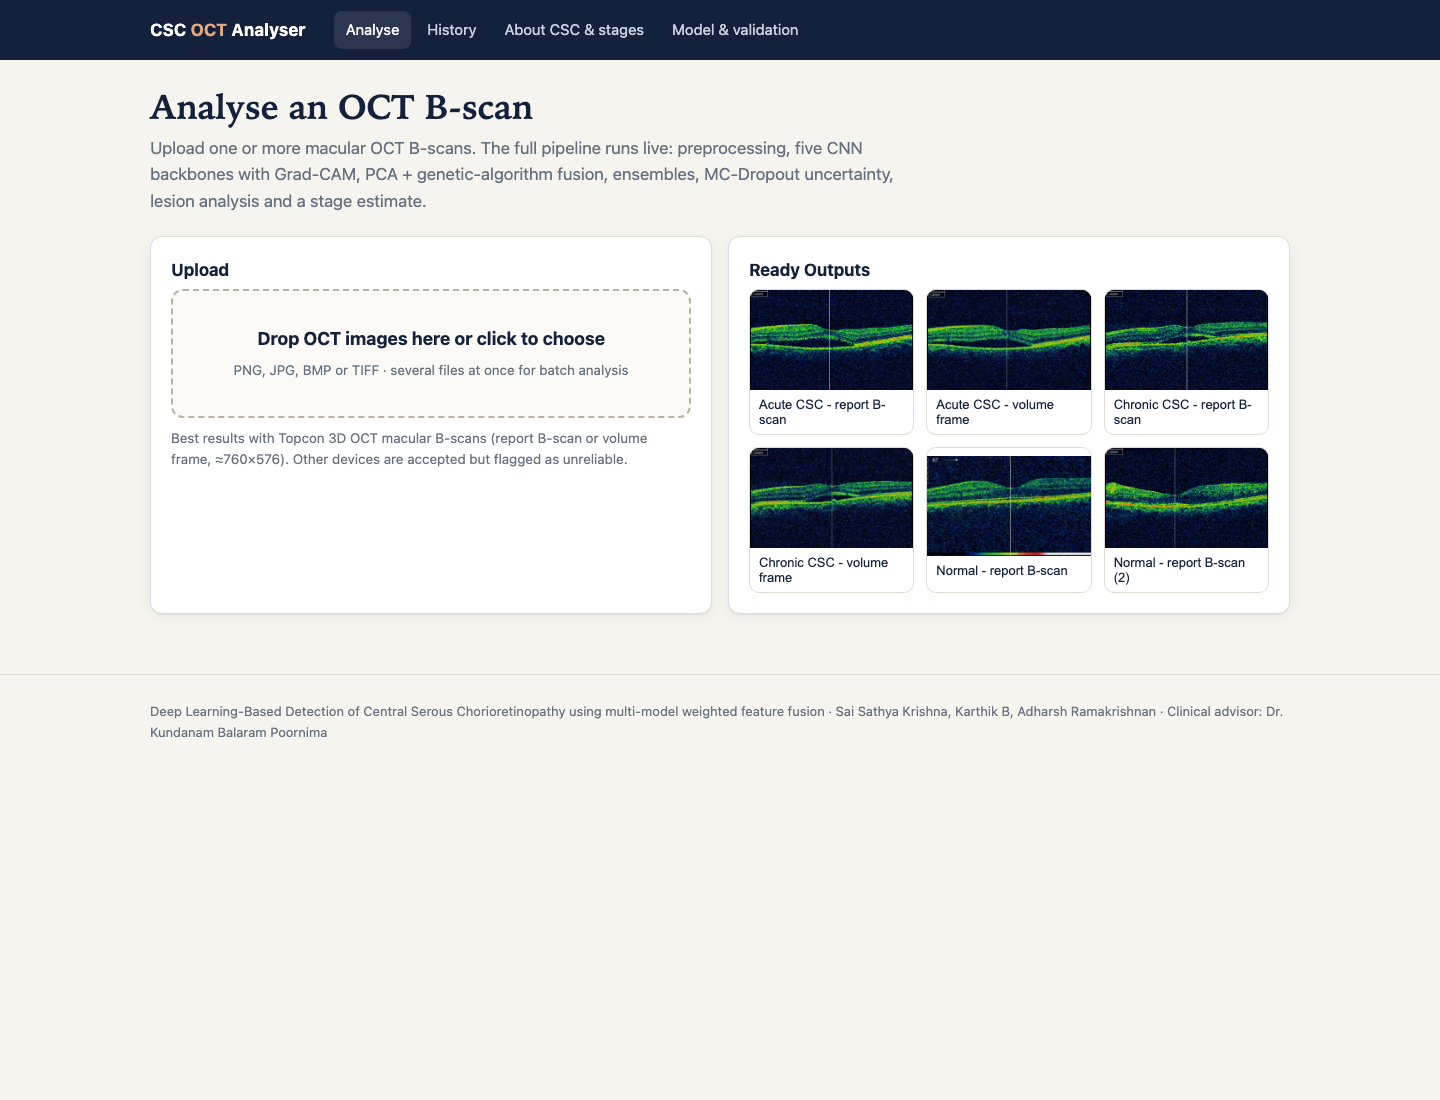
The app
Limitations
- Five CSC patients in the same-scanner data, so intervals are wide.
- Models do not transfer to other scanners in cross-dataset tests (AUC 0.435 and 0.600).
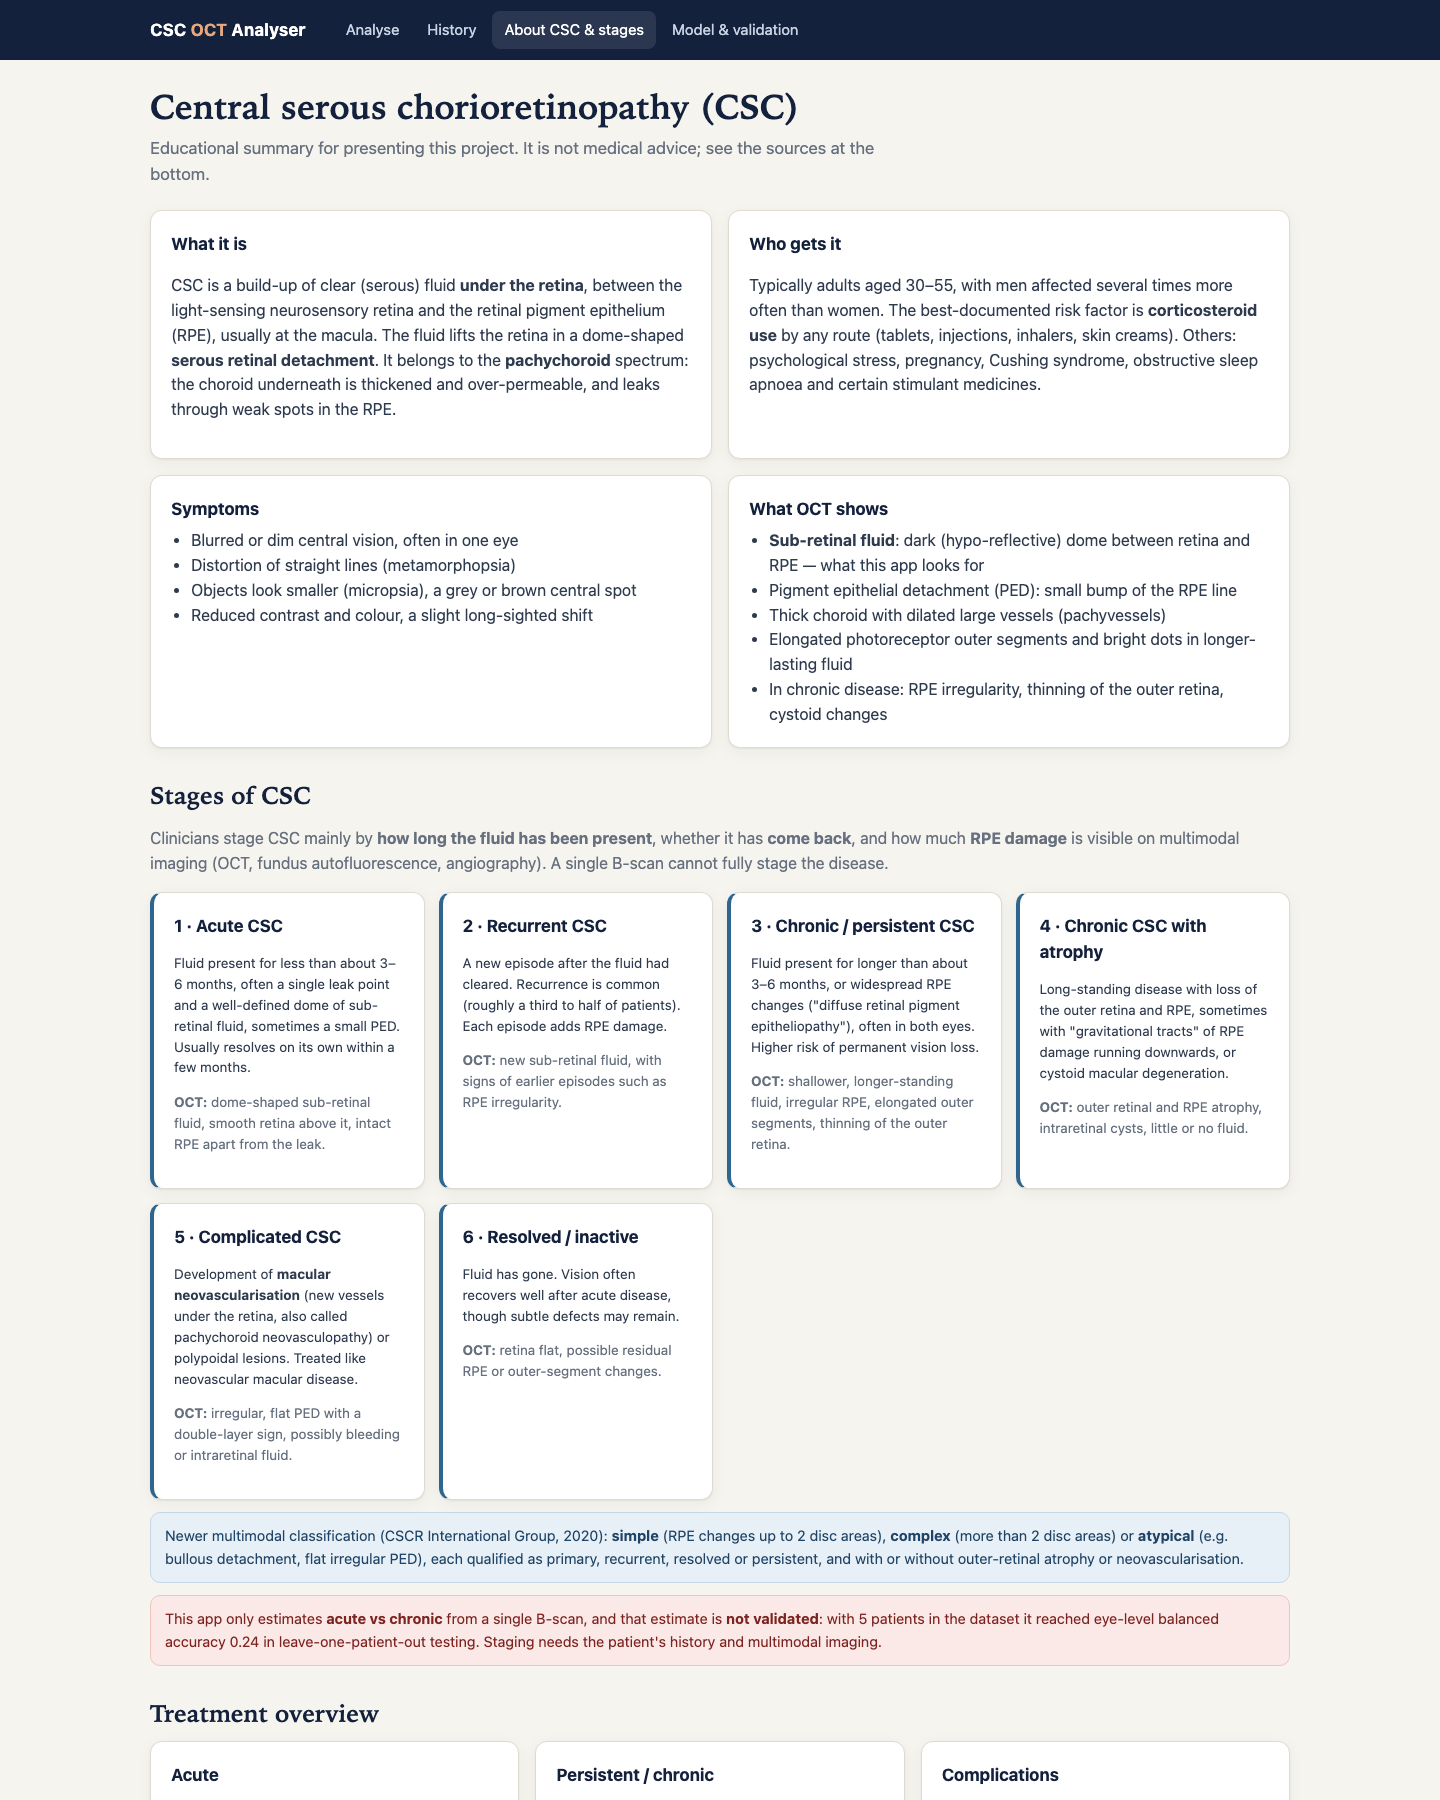
- Acute versus chronic subtyping is experimental and not reliable.